Thursday, 30 April 2015
Wednesday, 22 April 2015
Important reminder
As we are
approaching the end of the course, I feel there is a need to remind you about
some important dates and events.
Week 10 (current)
Tomorrow 23rd April
you will conduct your survey in class and will proceed with the evaluation of
the results. You may go beyond the class limit and interview more people if you
like.
I assume you
have already done some literature review within two and a half weeks. We will
go through some parts of the Research Report again this week.
1. Assignment
6 Causes and Effects (your
final) has to be submitted by Friday (24th
April) by 3pm.
2.
Listening
test 2 will be held in both EAP2 classes on Friday (24th April) at 9am.
Week
11 (27th April-1nd May) Monday is Anzac Day, a public
holiday.
3. The first
draft of the Research Report should be submitted by Monday 27th April by 10pm for editing.
4.
Presentations Research 4 will be given on Wednesday,
Thursday, Friday (29th - 30th April & 1st May),
in three groups.
5. You will be given edited Research Report 4 back on Wednesday to be finalised and
submitted on Sunday 3rd May
by 10p.m.
Week
12 (4th May- 8th May)
6.
The TEP test .The date will be confirmed.
You will be given Listening,
Reading and Writing based tasks.
Your Speaking
skills will be assessed by the tutor (Tanya) based on your Final
Presentation.
Wednesday 6th May / Thursday 7th
May
You will be
informed about your score for the EAP2 class based on your course contribution,
which includes:
Assignment
1,2,3,4,5, 6
Research
1,2,3,4,
Research
Report
Listening
Test 1&2
TEP test
Reading and
Vocabulary tests ( Skills Class)
Blogging
__________________________________________________________________
Students who are high (A) and good (B) achievers will
be given recommendations for tertiary programmes in AIS.
Note: the dates for the submission of the Assignment 6 & Research Report are given as a deadline , so
feel free to submit them earlier if you feel so ( e.g. Miyuki for Assignment 6
( first draft) and Leanne ( final ). You can earn more credits and save time.
Good luck to you all!
Thursday, 9 April 2015
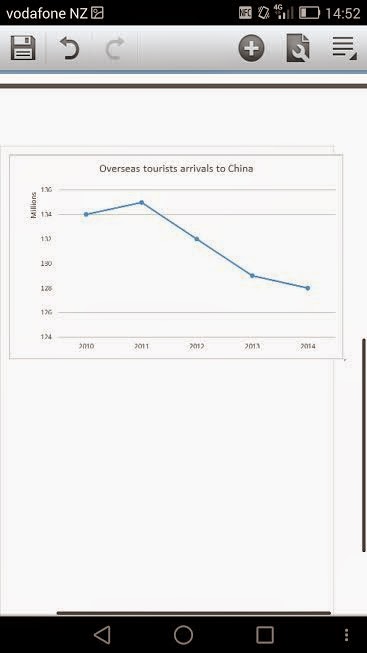
International toruists in China
This line graph shows the number of international
tourists who came to China in millions from 2010 to 2014.
In
2010, there were approximately 133 million international tourists in China. This number reached a peak of 135 million in 2011. Surprisingly, the number of foreign visitors decreased steadily to 129 million between 2012 and
2013. Continuously, in 2014 it followed by a slight fall to 128 million which
reached the lowest point in past five years.
Overall,
the graph presents that the most popular period of China inbound tourism was 2011 and slipped
slightly from 2012 to 2014.
Reference
China National Tourism Administration. (n.d.). China Tourism.
Retrieved from
http://www.travelchinaguide.com/tourism/
The number of international tourists in China between 2012 and 2014
The number of international tourists
in China between 2012 and 2014
This bar chart shows numbers of international tourists from the five foreign
countries between 2012 and 2014, and the five countries are the most numbers of
tourists in the last three years.
In the past three years, the
number of South Korean tourists is the largest, but did not grow steadily. They
fluctuated around 4 million between 2012 and 2014. There was a drop of more
than 500 thousands to the second most country, the Japan, with a sharp decrease
between 2012 and 2014, and a steady fall in 2014. The third country was the
United States, with a steady decrease around 2.4 million. This was followed by
Russia. In the past three years, the Russians decreased steadily between 2.2
and 2.1 million. The Vietnamese made up the least group to travel to China, but
it was only a group of rising in the top five. It went up gradually.
Overall, the bar chart shows that
the South Korean was the most larger group to travel to China, and the
Japanese, American, Russian and Vietnamese followed the top one and was located
in the top five.
Reference list
China Inbound Tourism in 2012. (2012). Travel China Guide.
Retrieved from: http://www.travelchinaguide.com/tourism/2012statistics/
China Inbound Tourism in 2013. (2013). Travel China Guide.
Retrieved from: http://www.travelchinaguide.com/tourism/2013statistics/
China Inbound Tourism in 2014. (2014). Travel China Guide.
Retrieved from: http://www.travelchinaguide.com/tourism/2014statistics/
China Tourism Hotel Booking Data
The bar chart
shows hotel bookings by tourists from foreign countries who visited
China in 2014.
This is a column
chart showing five cities. According to the chart, the largest number of
overseas tourists were accommodation in Peking, so there were approximately 50000
people were hotel bookings. Shanghai made up the second-largest account, about
37000 people. Wuxi made up the smallest, no more than 2000 people.
Overall, a number of people were arriving in Chinese cities.
Reference
Globe
newswire (2015).China Tourism
Statistics and Hotel Booking Data for 2014. Retrieved http://www.globenewswire.com
Wednesday, 8 April 2015
The number of tourists in china
 This graph shows the tourism in china, in millions, from 2010 to 2014.
 In 2010, there were approximately 133.7 million tourism. Then a gradual rise in 2011, reaching a peak of 135.4 million tourism in china. Then in 2012 it dropped suddenly to about 132.4 million. Followed by a steady fall in 2013 about 129.1 million. At the end of the 2014 the tourism in china reached the lowest 128.4 million.
Overall, the graph shows that the most popular period for tourism in china is 2011. The least popular time is 2013 to 2014.
Reference
China National Tourism Administration. (n.d). China Tourism. Retrieved April 7, 2015, from http://www.travelchinaguide.com/tourism/
The number of tourists to China between 2010 and 2014
We can see the number of visitors came to China for travelling were under 134 million in 2010. However, the numbers increased steadily which was the top in 2011. Between 2011 and 2013, the visitors were decreased gradually. In 2014, the visitors was 129 million which was the lowest population .
All in all, from 2011, the numbers of visitors who came to China for travelling fell down steadily continued four years.
Reference
China inbound tourism. (n.d.). Travel China Guide.
Retrieved from:http://www.travelchinaguide.com/tourism/2014statistics/inbound.htm
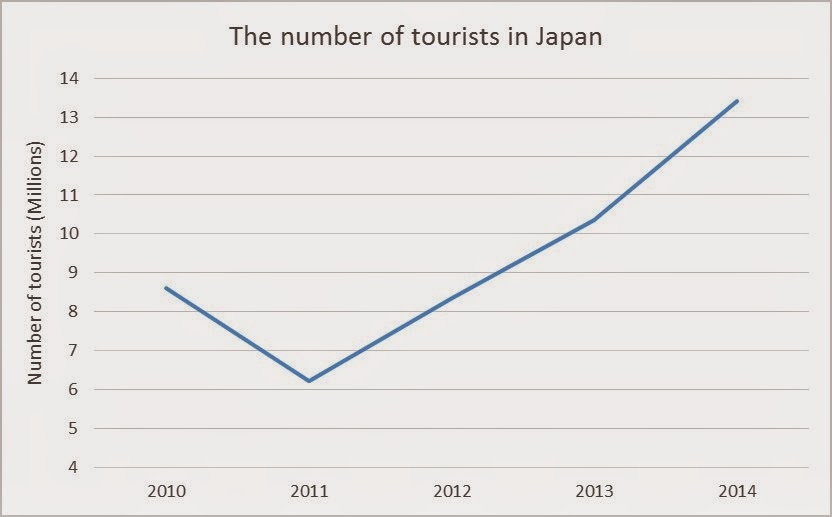
The number of tourists in Japan
by Japan Tourism Marketing Co. (2015)
This
line graph illustrates number of tourists in Japan between 2010 and 2014.
The
amount of travelers decreased dramatically from nearly nine million to six million
as lowest point between 2010 and 2011 because Japan was suffered severe earthquake
in 2011. However, it increased rapidly from six million to ten million from 2011
to 2013. In 2014, it reached top with thirteen million.
In summary, the number of tourist in Japan fell quickly to lowest number in 2011 and it rose rapidly from 2011 to 2014.
In summary, the number of tourist in Japan fell quickly to lowest number in 2011 and it rose rapidly from 2011 to 2014.
Tourists to China from 2010 to 2014
M0K%5B%24BBOV%7DXU%25%5BGRV.png)
This line graph illustrate the number of international visitors visit to China between rent five years from 2010 to 2014.
As can be seen from the line graph, there were about 134 million oversea viistors come to China. Then there is a slight rise from 134 to 135 betwwen 2010 and 2011. This was followed by a significant decline from 132 in 2012 to 129 in 2013. Then the number kept decreased trend, a steady fall from 129 in 2013 to 128 in 2014.
To conclude, the overall trend for overseas visitors arrival to China was decreased , but the gap between the maximum number and the minimal number was not significant.
Reference
China National Tourism Administration. (n.d.). China Tourism.
Retrieved from http://www.travelchinaguide.com/tourism/
M0K[$BBOV}XU%[GRV.png)
M0K[$BBOV}XU%[GRV.png)
Tuesday, 7 April 2015
The number of tourist arrivals in China
Reference:
Tourism Market in China. (2013). Beijing: The EU SME Centre.
Foreign tourists visited Indonesia between 2009 - 2013
The
line graph shows the number of visitors to Indonesia from 2009 – 2013.
As
we see from year 2009 to 2012 the numbers shows us a steady growth. There was
no significant increase during that time. In the other hand, It took 4 years to
reach 8 million visitors to come to Indonesia. This is actually a very slow
movement according Arief Yahya, Indonesia’s Minister Tourism.
Furthermore
in order to improved that situation, in 2012 Indonesia’s government launced a new
regulation for tourist from some country do not need to apply visa to visit
Indonesia. And this regulation culminated in a significant increased of visitor by
2012. As shows in the graph, it reached almost more than 1 million tourists in
only one year, from 2012 to 2013.
Over all, these data shows
that Indonesian tourism growth was satisfactory. Between 2009 - 2013, there was
never any decreasing. Hopefully next year, the number of tourists who come to
Indonesia will continue to rise even better.
Reference
Indonesia Investment, (2015). Tourism in Indonesia: 9.3 million foreign visitors expected in 2014.
headlines/tourism-in-indonesia-9.3-million-foreign-visitors-expected-in-
2014/item5174
Subscribe to:
Comments (Atom)


